What is Wireshark?
Wireshark is a network packet capture and analysis that is freely available to download. It is compatible to Linux, Windows and macOS operating systems. Wireshark is regarded one of the best tool to carry out network analysis and has been the favorite among network engineers, security analysts, incident responders, and digital forensic investigators for a very long time.
It has a very simple GUI interface combined with extremely powerful filtering, decoding, and analysis capabilities. In recent years, it has become increasingly powerful with continuous upgrades and community contributions making it one of the most advanced packet analysis tools available today.
Understanding the Wireshark Interface
The interface of the tool is divided into multiple windows and panes, each serving a particular purpose in the packet analysis workflow. Understanding these components is essential for efficiently analyzing network traffic.
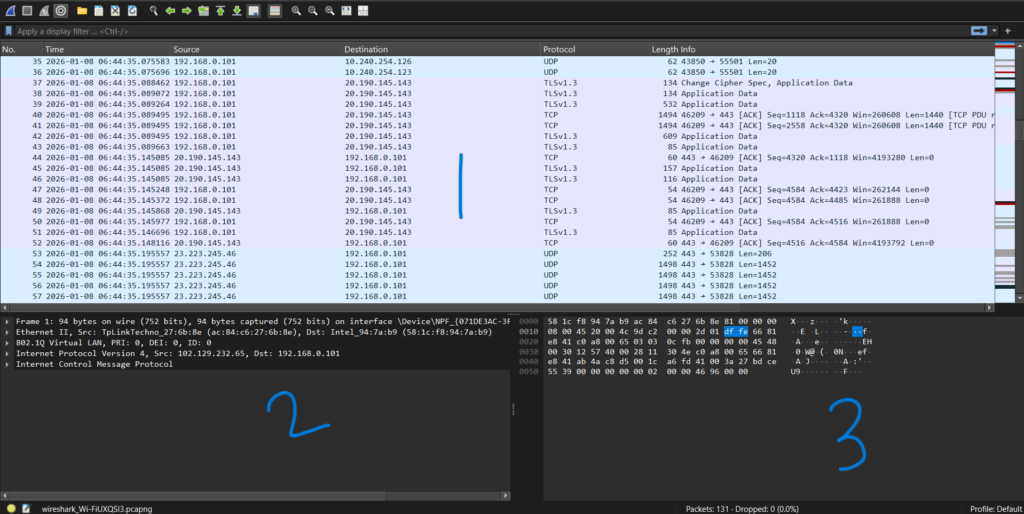
1. Packet List Pane
The packet list pane is the top pane in the main Wireshark window. It displays a summary of all captured packets in a tabular format. Each row in this table represents a single packet and typically shows Packet number, Timestamp, Source IP address, Destination IP address, Protocol (TCP, UDP, HTTP, DNS, etc.), Length, and Short description of the packet. This pane assists security analysts to quickly detect suspicious traffic patterns, anomalies, or (interesting)packets.
2. Packet Details Pane
The Packet Details Pane is present in the bottom-left of the interface. It provides a structured, hierarchical view of the selected packet. This pane breaks down the packet into different TCP/IP layers, such as Frame information, Ethernet header, IP header, Transport layer (TCP/UDP), Application layer (HTTP, DNS, SMB, etc.). Each layer can be expanded to view detailed technical fields like flags, sequence numbers, ports, and checksums. This pane is crucial for deep packet inspection and protocol analysis.
3. Packet Bytes Pane
The Packet Bytes Pane is present at the bottom-right of the Wireshark Interface. It displays the raw packet data in both hexadecimal and ASCII formats. This pane is useful for examining raw payload data, identifying embedded strings, credentials, or commands, understanding how data is transmitted at the byte level. The corresponding bytes are highlighted when a field is selected in the Packet Details Pane, making correlation easier.
Difference between .pcap and .pcapng file format.
The widely-used formats for wireshark packet capture are pcap or pcapn. It is important to mention that there are other formats that Wireshark support like .pcapng.gz, .cap, .erf, .snoop(solaris packet capture), .ncf. Pcap stands for packet capture and pcapng stands for Packet capture-Next generation.
Pcap– This is the original and legacy packet capture format. Pcap stores basic packet data such as Packet headers, Packet payload. It also supports only one capture interface per file. However, the downside of pcap format is limited metadata support (no interface details, comments, or statistics). Pcap files are very lightweight and therefore are highly compatible with almost all network analysis tools. They are still widely used to this day as they best in terms of simple captures and maximum tool compatibility.
Pcapng– Pcapng is an enhanced and modern upgradation for PCAP. It supports multiple capture interfaces in a single file. Pcapng is useful for storing additional metadata such as Interface names and types are are also capable of capturing comments and annotations. Another benefit of it is that it gives us Timestamps with higher precision, much more efficient than pcap format. Nevertheless, all these features make pcapng more flexible and powerful for forensic analysis. Wireshark have made pcapng as the default capture format in modern versions. And it has became best suited for advanced network traffic analysis.
Alternatives to Wireshark
- Tshark– Command-line version of Wireshark, ideal for scripting, automation, and server-side packet analysis.
- Tcpdump– Lightweight CLI packet capture tool commonly used on Linux systems for quick traffic investigation.
- Zeek (Bro)– Network security monitoring tool that analyzes traffic and generates valuable, structured logs instead of raw packets.
- Suricata– IDS/IPS and network security monitoring engine with deep packet inspection and rule-based detection.
- Snort– Signature-based intrusion detection and prevention system used to detect malicious network activity.
- NetworkMiner– Passive network forensic analysis tool used to extract files, credentials, and artifacts from PCAP files.
- SolarWinds Packet Analysis Tool– Enterprise-grade packet analysis tool for troubleshooting and performance monitoring.
- CloudShark– Web-based PCAP analysis platform useful for sharing and collaborative packet analysis.
Lab Time
Scenario
In September 2020, SOC detected suspicious activity from a user device, flagged by unusual SMB protocol usage. Initial analysis indicates a possible compromise of a privileged account and remote access tool usage by an attacker.
Our task is to examine network traffic in the provided PCAP files to identify key indicators of compromise (IOCs) and gain insights into the attacker’s methods, persistence tactics, and goals. We need to construct a timeline to better understand the progression of the attack by addressing the following questions.
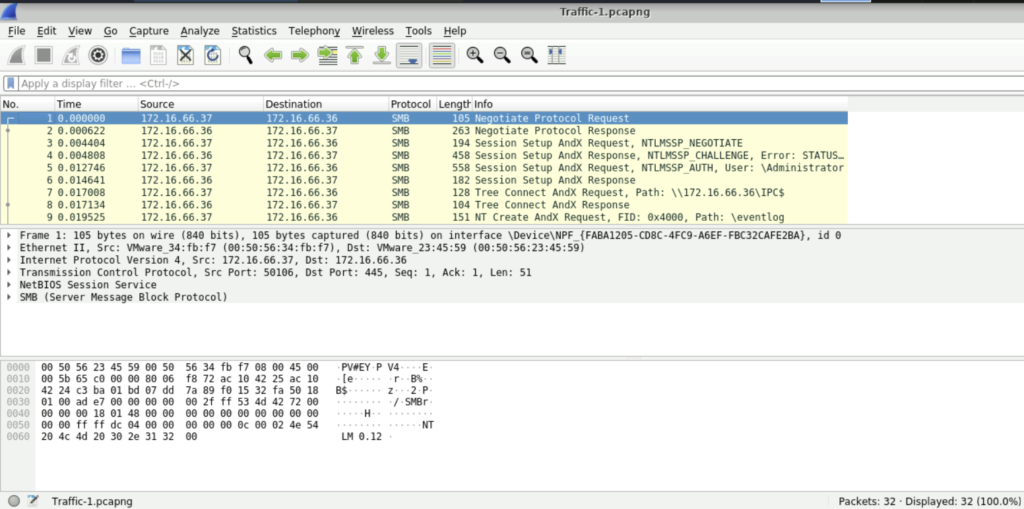
File Used: Traffic-1.pcapng
Question: The attacker’s activity showed extensive SMB protocol usage, indicating a potential pattern of significant data transfer or file access. What is the total number of bytes of the SMB protocol?
Step 1: Open the Traffic-1.pcapng file using Wireshark
Step 2: The first step is to examine the Protocol Hierarchy of the captured file. The Protocol Hierarchy provides a high-level overview of the traffic by listing all protocols used and the amount of data exchanged by each protocol in a structured, tabular format.
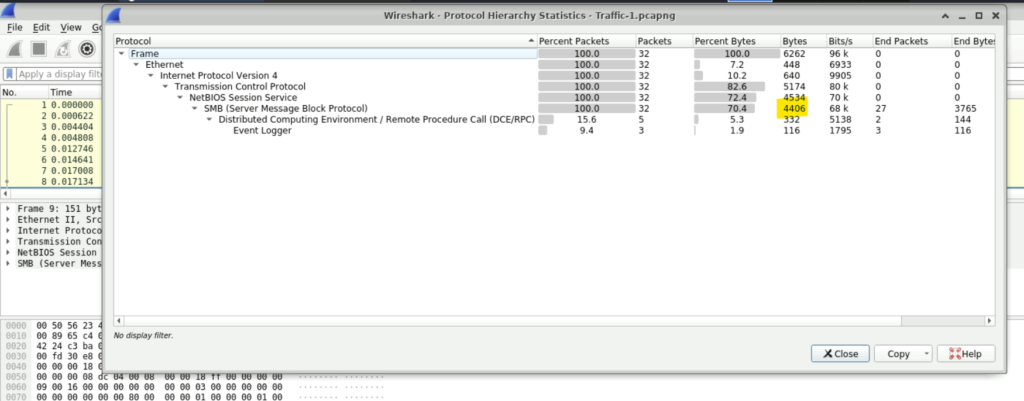
Step 3: To open Protocol Hierarchy, we need to go to Statistics and then select Protocol Hierarchy. We find in protocol hierarchy that the total bytes corresponding to SMB is 4406 which answers our question.
Question: Authentication through SMB was a critical step in gaining access to the targeted system. Identifying the username used for this authentication will help determine if a privileged account was compromised. Which username was utilized for authentication via SMB?
Step 1: Just after a few packets, we can see that the User name that was used for authentication is Administrator.
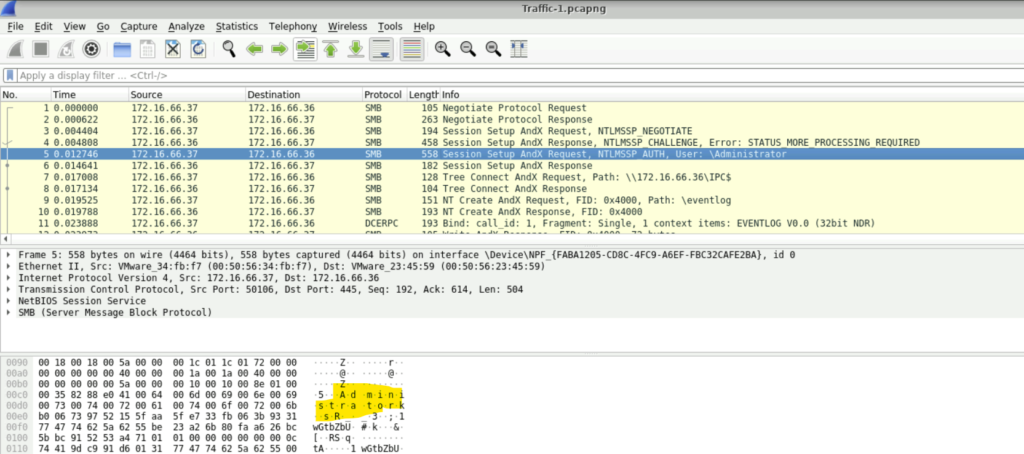
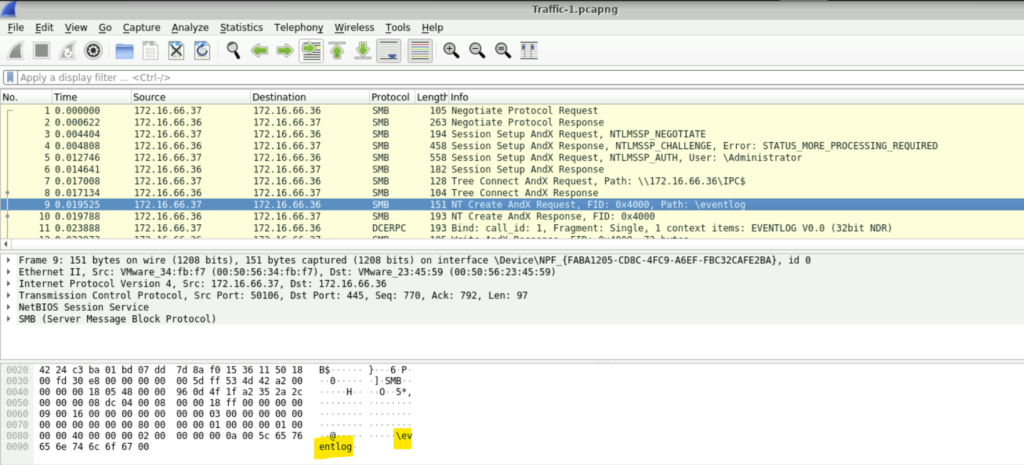
Question: During the attack, the adversary accessed certain files. Identifying which files were accessed can reveal the attacker’s intent. What is the name of the file that was opened by the attacker?
Step 1: A few packets later, we can see the Path of the file opened. Yes it is eventlog.
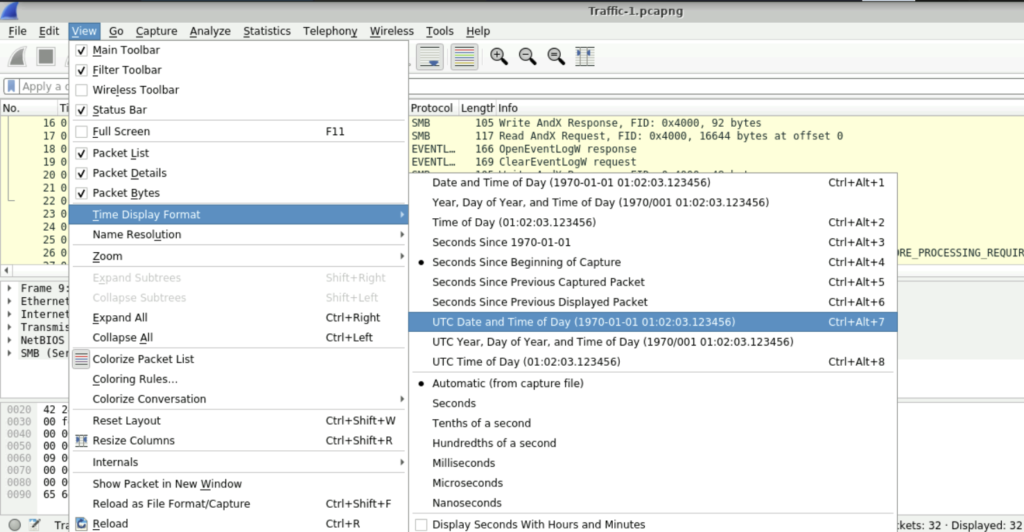
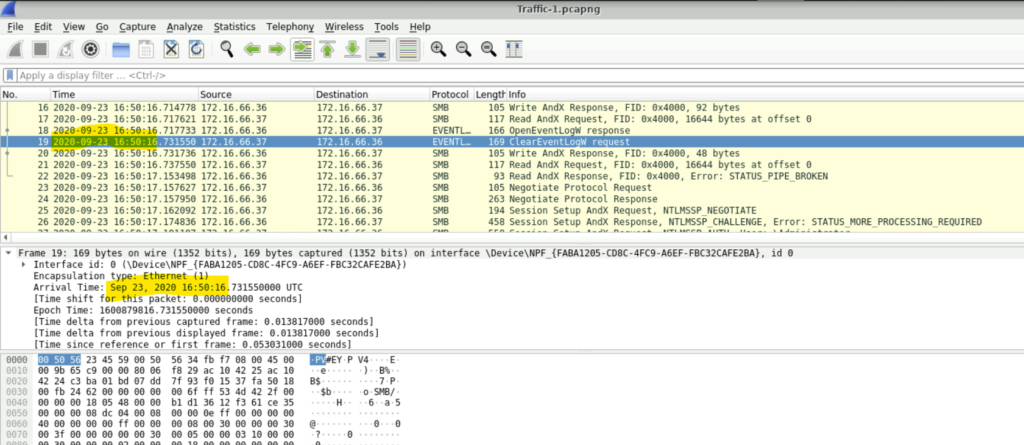
Question: Clearing event logs is a common tactic to hide malicious actions and evade detection. Pinpointing the timestamp of this action is essential for building a timeline of the attacker’s behavior. What is the timestamp of the attempt to clear the event log? (24-hour UTC format)
Step 1: By default, the time format in Wireshark is not given in 24-hour UTC format. So we need to set it in that way. To do this. We must select View and then select Time Display format.
Step 2: Select the format we want. In this case UTC Date and Time of Day.
Step 3: In the question, we are asked to find the timestamp of the attempt to clear log. If we scroll down a bit, we will see a ClearEventLog request. We just need to note the timestamp which is Sep 23, 2020 16:50:16 UTC.
File Used: Traffic-2.pcapng
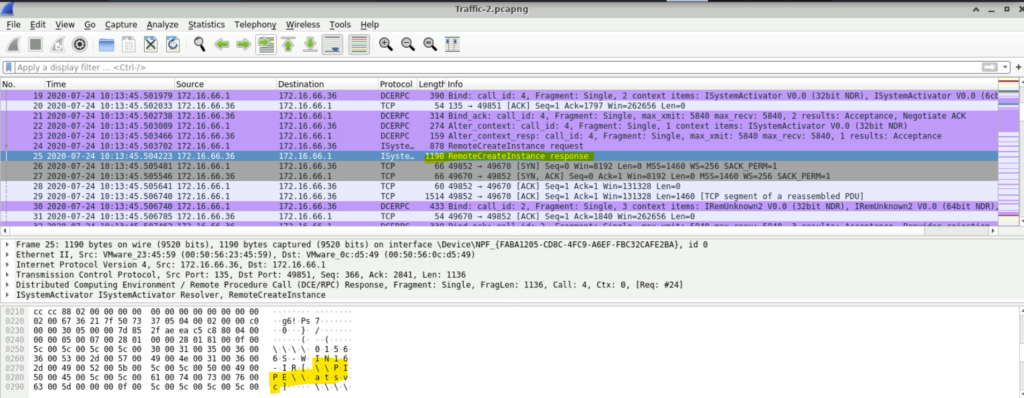
Question: The attacker used “named pipes” for communication, suggesting they may have utilized Remote Procedure Calls (RPC) for lateral movement across the network. RPC allows one program to request services from another remotely, which could grant the attacker unauthorized access or control. What is the name of the service that communicated using this named pipe?
Step 1: Open the Traffic-2.pcapng using Wireshark.
Step 2: Scrolling down we see that there is a RemoteCreateInstance response packet. If we select that packet and examine the Packet Bytes pane, we will find the name of the pipe which here is \\PIPE\\atsvc.
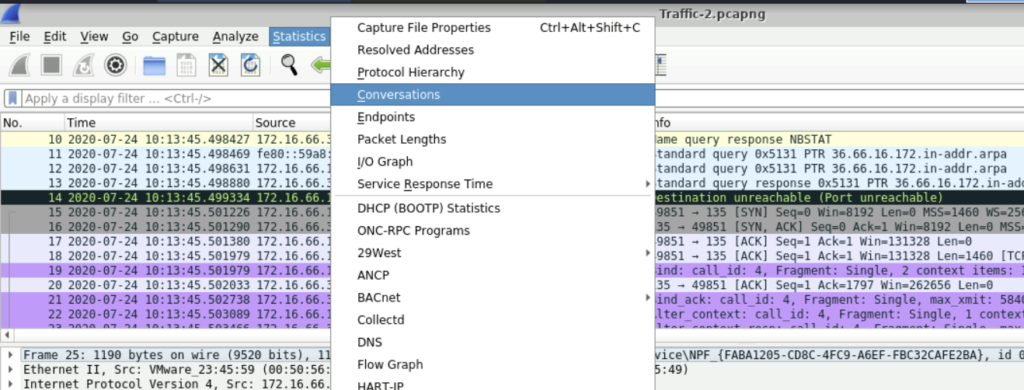
Question: Measuring the duration of suspicious communication can reveal how long the attacker maintained unauthorized access, providing insights into the scope and persistence of the attack.
What was the duration of communication between the identified addresses 172.16.66.1 and 172.16.66.36?
Step 1: To solve this question, we can use the Conversations table. Select Statistics and the navigate to Conversations.
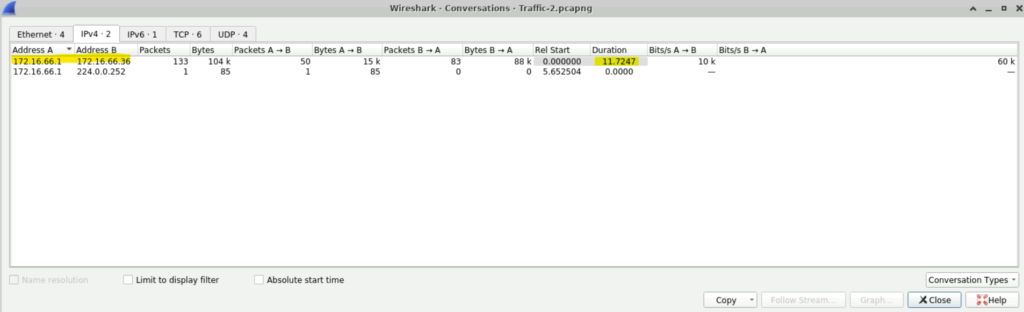
Step 2: Select IPv4 and in there we will find the duration of communication between 172.16.66.1 and 172.16.66.36, which is 11.7247.
File Used: Traffic-3.pcapng
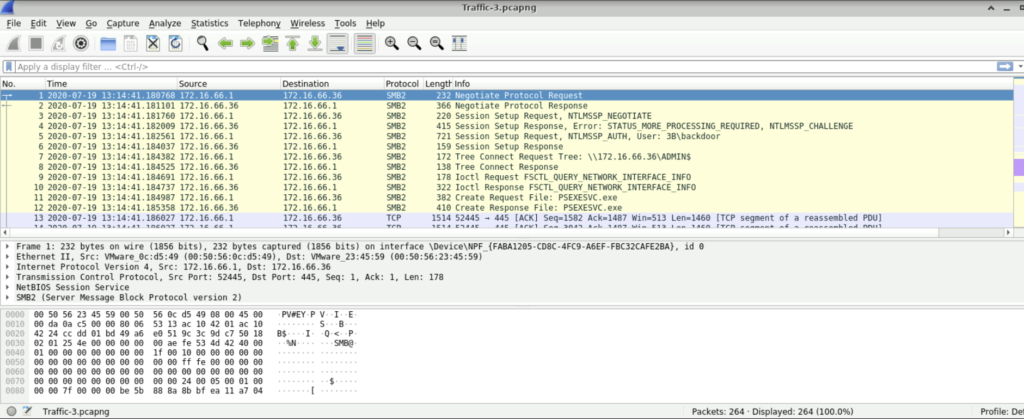
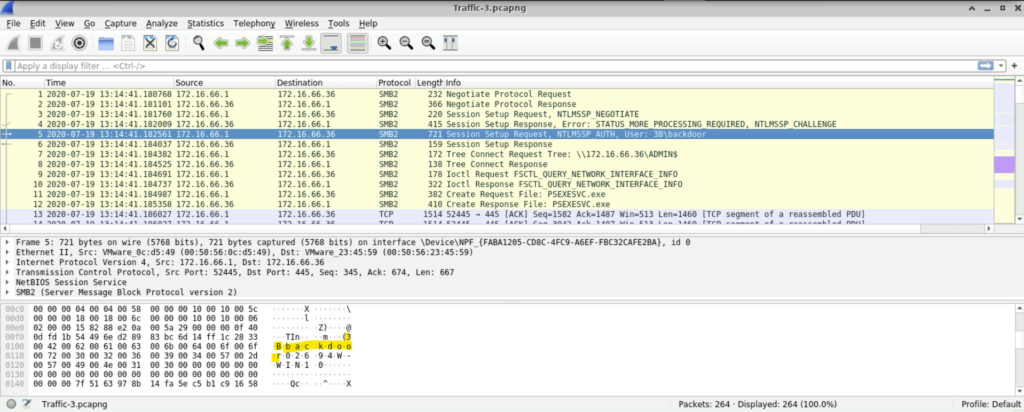
Question: The attacker used a non-standard username to set up requests, indicating an attempt to maintain covert access. Identifying this username is essential for understanding how persistence was established. Which username was used to set up these potentially suspicious requests?
Step 1: Open the Traffic-3.pcapng file using Wireshark.
Step 2: No need to scroll down, we see that the username is 3B\backdoor.
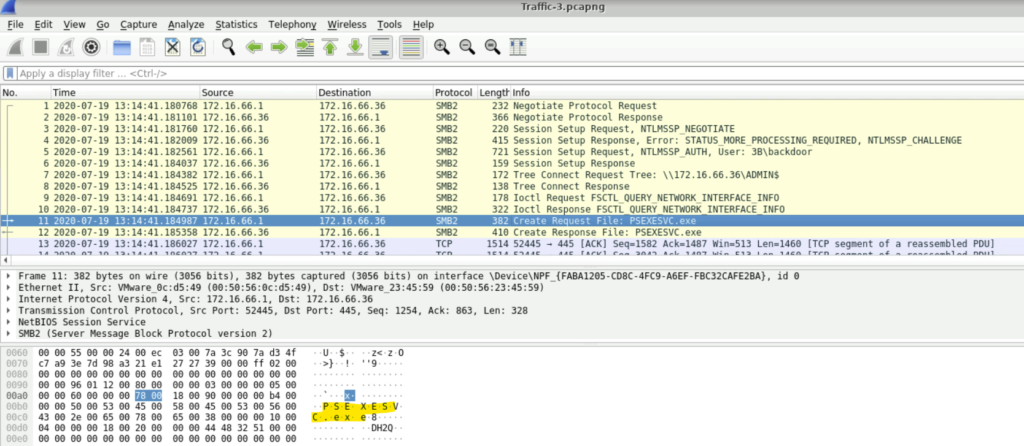
Question: The attacker leveraged a specific executable file to execute processes remotely on the compromised system. Recognizing this file name can assist in pinpointing the tools used in the attack. What is the name of the executable file utilized to execute processes remotely?
Step 1: If we scroll down, we will find the packet to Create Request File- PSEXESVC.exe. That is the executable file utilized to execute process remotely.
Conclusion
This lab served as a basic intro to use wireshark for network traffic analysis. Big companies do not just rely on Wireshark for network traffic analysis, instead they use similar tools with enhanced capabilities like Stealthwatch by Cisco, Darktrace, Corelight etc. These tools are more powerful than Wireshark and sometimes use AI-driven advanced network detection and response (NDR).
Nevertheless, this small exercise demonstrated the fundamental capabilities of capability of Wireshark. In the upcoming articles, we will go through more difficult Wireshark labs and deeper network analysis techniques.